Tectonics with Telescopes (TWT) is a science engagement program aimed at the
Grade 9 high school cohort. TWT provides students and
teachers with real, research-grade
data from radio telescopes, and a set of suggested
investigations into the present-day movement of tectonic
plates. These investigations are aligned with the Grade 9 national
curriculum, and can be easily incorporated into the
students' classroom learning.
The TWT program has been developed by physics staff at the University of Tasmania, and
delivery is facilitated by a professional scientist who will
typically visit the participating class for a presentation
and Q&A session. At the end of the program, students are
usually taken on tour of the UTAS Mt. Pleasant radio
astronomy observatory and the
Grote Reber
museum.
If you are a school teacher interested in participating in Tectonics
with Telescopes, please get in touch with Dr Stas
Shabala.
Brief background
Geodesy is the science of accurate positioning on Earth. It is used in
a wide variety of applications, ranging from studies of the
evolution of our whole planet (tectonic plate movement, sea level
rise) to local effects (ground subsidence), to
commercial applications (surveying, autonomous
trains/trucks/tractors, GPS watches). The best known way for measuring positions on
Earth is using Global Navigation Satellite Systems (GNSS, of which GPS is most widely used).
No measurement is perfect. The accuracy of satellite measurements such
as from GPS depends on the knoweldge of satellite's orbit around the
Earth. As the Earth rotates and gently wobbles in space,
these orbits become hard to determine unless we can measure
where both the satellites and the Earth are with respect to
something that doesn't move.
For this, we use radio telescopes and a technique called Very Long
Baseline Interferometry. This relies on observations of the
same object (usually a quasar, a type of active black hole)
at two or more telescopes to determine the exact distance
between the two telescopes. This is achieved by using high-precision
atomic clocks, and recording the precise
time of signals arriving at each telescope. Combining the
time delay between signals arriving at each telescope in a
pair, and multiplying this by the speed of light (300,000
km/second), the distance between two telescopes is
calculated.
VLBI is officially the world's most accurate ruler, routinely
measuring intercontinental distances of many thousands of kilometers
with an accuracy of a few centimeters!

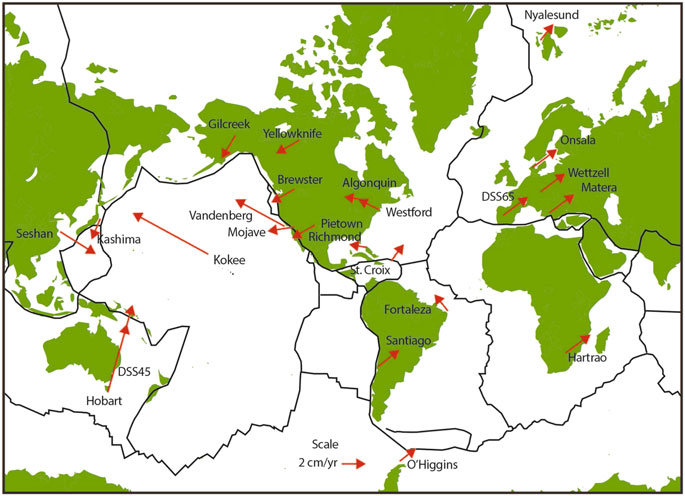
Telescope motion as captured by VLBI. Arrows show velocity vectors; large arrows mean faster motion. From Whitney et al. (2014).
In addition to helping measure accurate positions on Earth, VLBI is
also the method used to track spacecraft as they are
launched and travel through space - except instead of
picking up signals from distant quasars, this time the radio
telescopes detect a radio-emitting spacecraft beacon.
More details on the technical aspects of the VLBI technique can be
found here.
Data
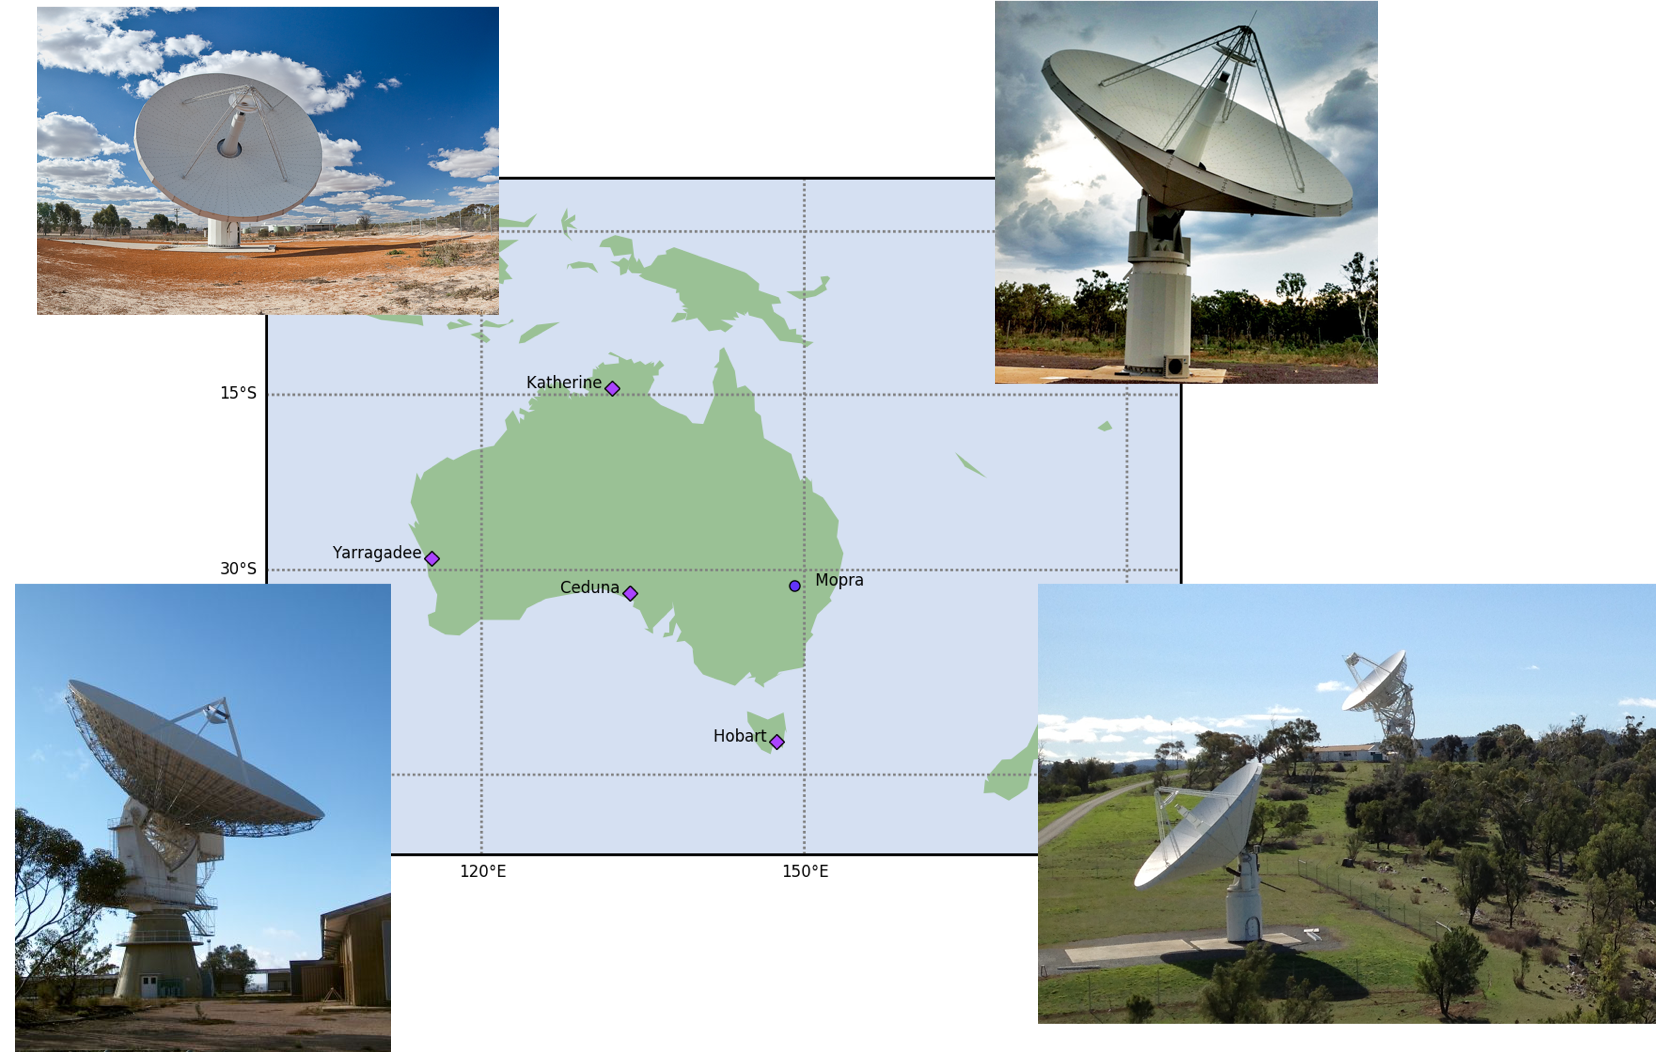
Data used in plate tectonics comes from University of Tasmania observatories around
Australia, and our partners from around the world. A file
containing data from most of the world's frequently observing stations can be freely
downloaded in Excel format.

The University of
Tasmania is the only university in the world to operate a
continent-wide array of radio telescopes.
In the Excel spreadsheet containing the data, separation betwen
telescopes (Column C) is given as a function of time (Column B). A
plot of the two therefore shows any relative movement between the two stations.
Investigations
The format of classroom investigations and assessment is left up to the teacher. The
data file contains sufficient data
to perform the following investigations.
-
Tectonic plates are moving, right now!
- Look at the map of station locations, and their
velocities. Choose a baseline (two stations) in the Excel
spreadsheet which will give you evidence that plates are moving.
- Make a plot of baseline length versus time.
- On your plot, add a trend line and an equation (right click
on a data point to add these).
- Why is the length changing over time?
- What can you conclude about the relative motion of the
tectonic plates on which these stations are located?
-
Intra-plate stability.
- Look at the map of where stations are located and use this to
choose which baseline (which two stations) will give you evidence to
show intraplate stability.
- Make a plot of baseline length vs time.
- On your plot, add a trend line and an equation (right click
on a data point to add these).
- Why is the length not changing over time?
-
Earthquakes.
- Determine the location of a major earthquake that has
happened in the last 25 years (the recent earthquake in Peru won't
be shown in this data).
- Look at the map of where stations are located, and the Excel
spreadsheet, and use this to choose which baseline (which two
stations) may show you what happens to plate positions when an
Earthquake occurs.
- From the graph, can you determine when the Earthquake
occurred?
- Explain what happens to the graph.
- What can you say about the rate at which the distance between
telescopes is changing? What do you think it means?
-
Mid-Atlantic ridge.
- Look at the maps of where stations are located and use this to
choose which two baselines (which two pairs of stations) may give
you information about the Mid-Atlantic ridge.
- Plot baseline length vs time for the two baselines.
- On your plot, add a trend line and an equation (right click on
a data point to add these).
- Do you notice any similarities between their behaviour?
- Looking at the map, why do you think that may be?
-
Challenge Question 1: Where is Tasmania going?
- Using a set of baselines, determine whether Tasmania is moving
North or South.
-
Challenge Question 2: The size of the Earth.
- Using the baseline length of Yarragadee - Seshan and your knowledge of
trigonometry, can you calculate the radius of the Earth?
[Hint: these stations are at approximately the same longitude (see \StationCoordinates tab in the Excel spreadsheet)].
Participating schools
Since Tectonics with Telescopes was rolled out in Tasmanian high
schools in 2019, we have collaborated with the following schools:
- Taroona High School
- Huonville High School
- The Hutchins School
- Fahan School
If you are a teacher and would like to participate in Tectonics with
Telescopes, please email Dr Stas Shabala

